Volatility-based Optimization
Last updated: 2025-02-26
Risk Parity
Risk parity optimization is a unique investment approach that seeks to build a more balanced portfolio by allocating assets based on their individual volatility rather than their expected returns. This means that assets with higher volatilities receive lower allocations, while those with lower volatilities receive higher allocations. This unconventional approach aims to optimize the risk-return tradeoff of the portfolio, potentially leading to higher returns without compromising overall risk. Concretely, each position is weighted inversely to its own volatility, which equalizes each asset's standalone volatility contribution (its weight times its volatility). This is a deliberate simplification — it neglects the correlations (covariance) between assets, so it does not equalize each asset's contribution to total portfolio risk, as full risk-parity methods aim to do. Because positions are sized from volatility rather than from uncertain return forecasts, the result is a naturally diversified portfolio that is less vulnerable to the outsized swings of any one investment.
Benefits of risk parity optimization:
- Potential for higher returns: By allocating assets based on their individual volatility, risk parity portfolios can potentially achieve higher Sharpe ratios compared to traditional approaches.
- Improved risk diversification: Diversification across a wide range of asset classes can help to reduce the overall risk of the portfolio, making it more resilient to market fluctuations.
- Reduced reliance on market timing: Risk parity strategies do not require active market timing, as they focus on asset allocation based on volatility rather than anticipating market movements.
Drawbacks of risk parity optimization:
- Potential for increased volatility: Risk parity portfolios can be more volatile than traditional mean-variance portfolios, especially during periods of market stress.
- Requires careful management: Effective implementation of risk parity strategies requires careful consideration of asset allocation, leverage, and risk management techniques.
- Suitability for specific investment goals: Risk parity may not be suitable for all investors, particularly those with a low risk tolerance or short-term investment horizons.
Volatility
Volatility is a statistical measure of the dispersion of data around its mean over a certain period of time. It is calculated as the standard deviation multiplied by the square root of the number of periods of time, T.
Volatility optimization, while not being a true optimization, generates weights directly proportional to the volatility of its constituents. It has roughly the same benefits and drawbacks as the above Risk Parity optimization.
The main difference between ATR and Volatility is that ATR considers the true prive range (daily highs / lows) whereas Volatility operates based on closing prices.
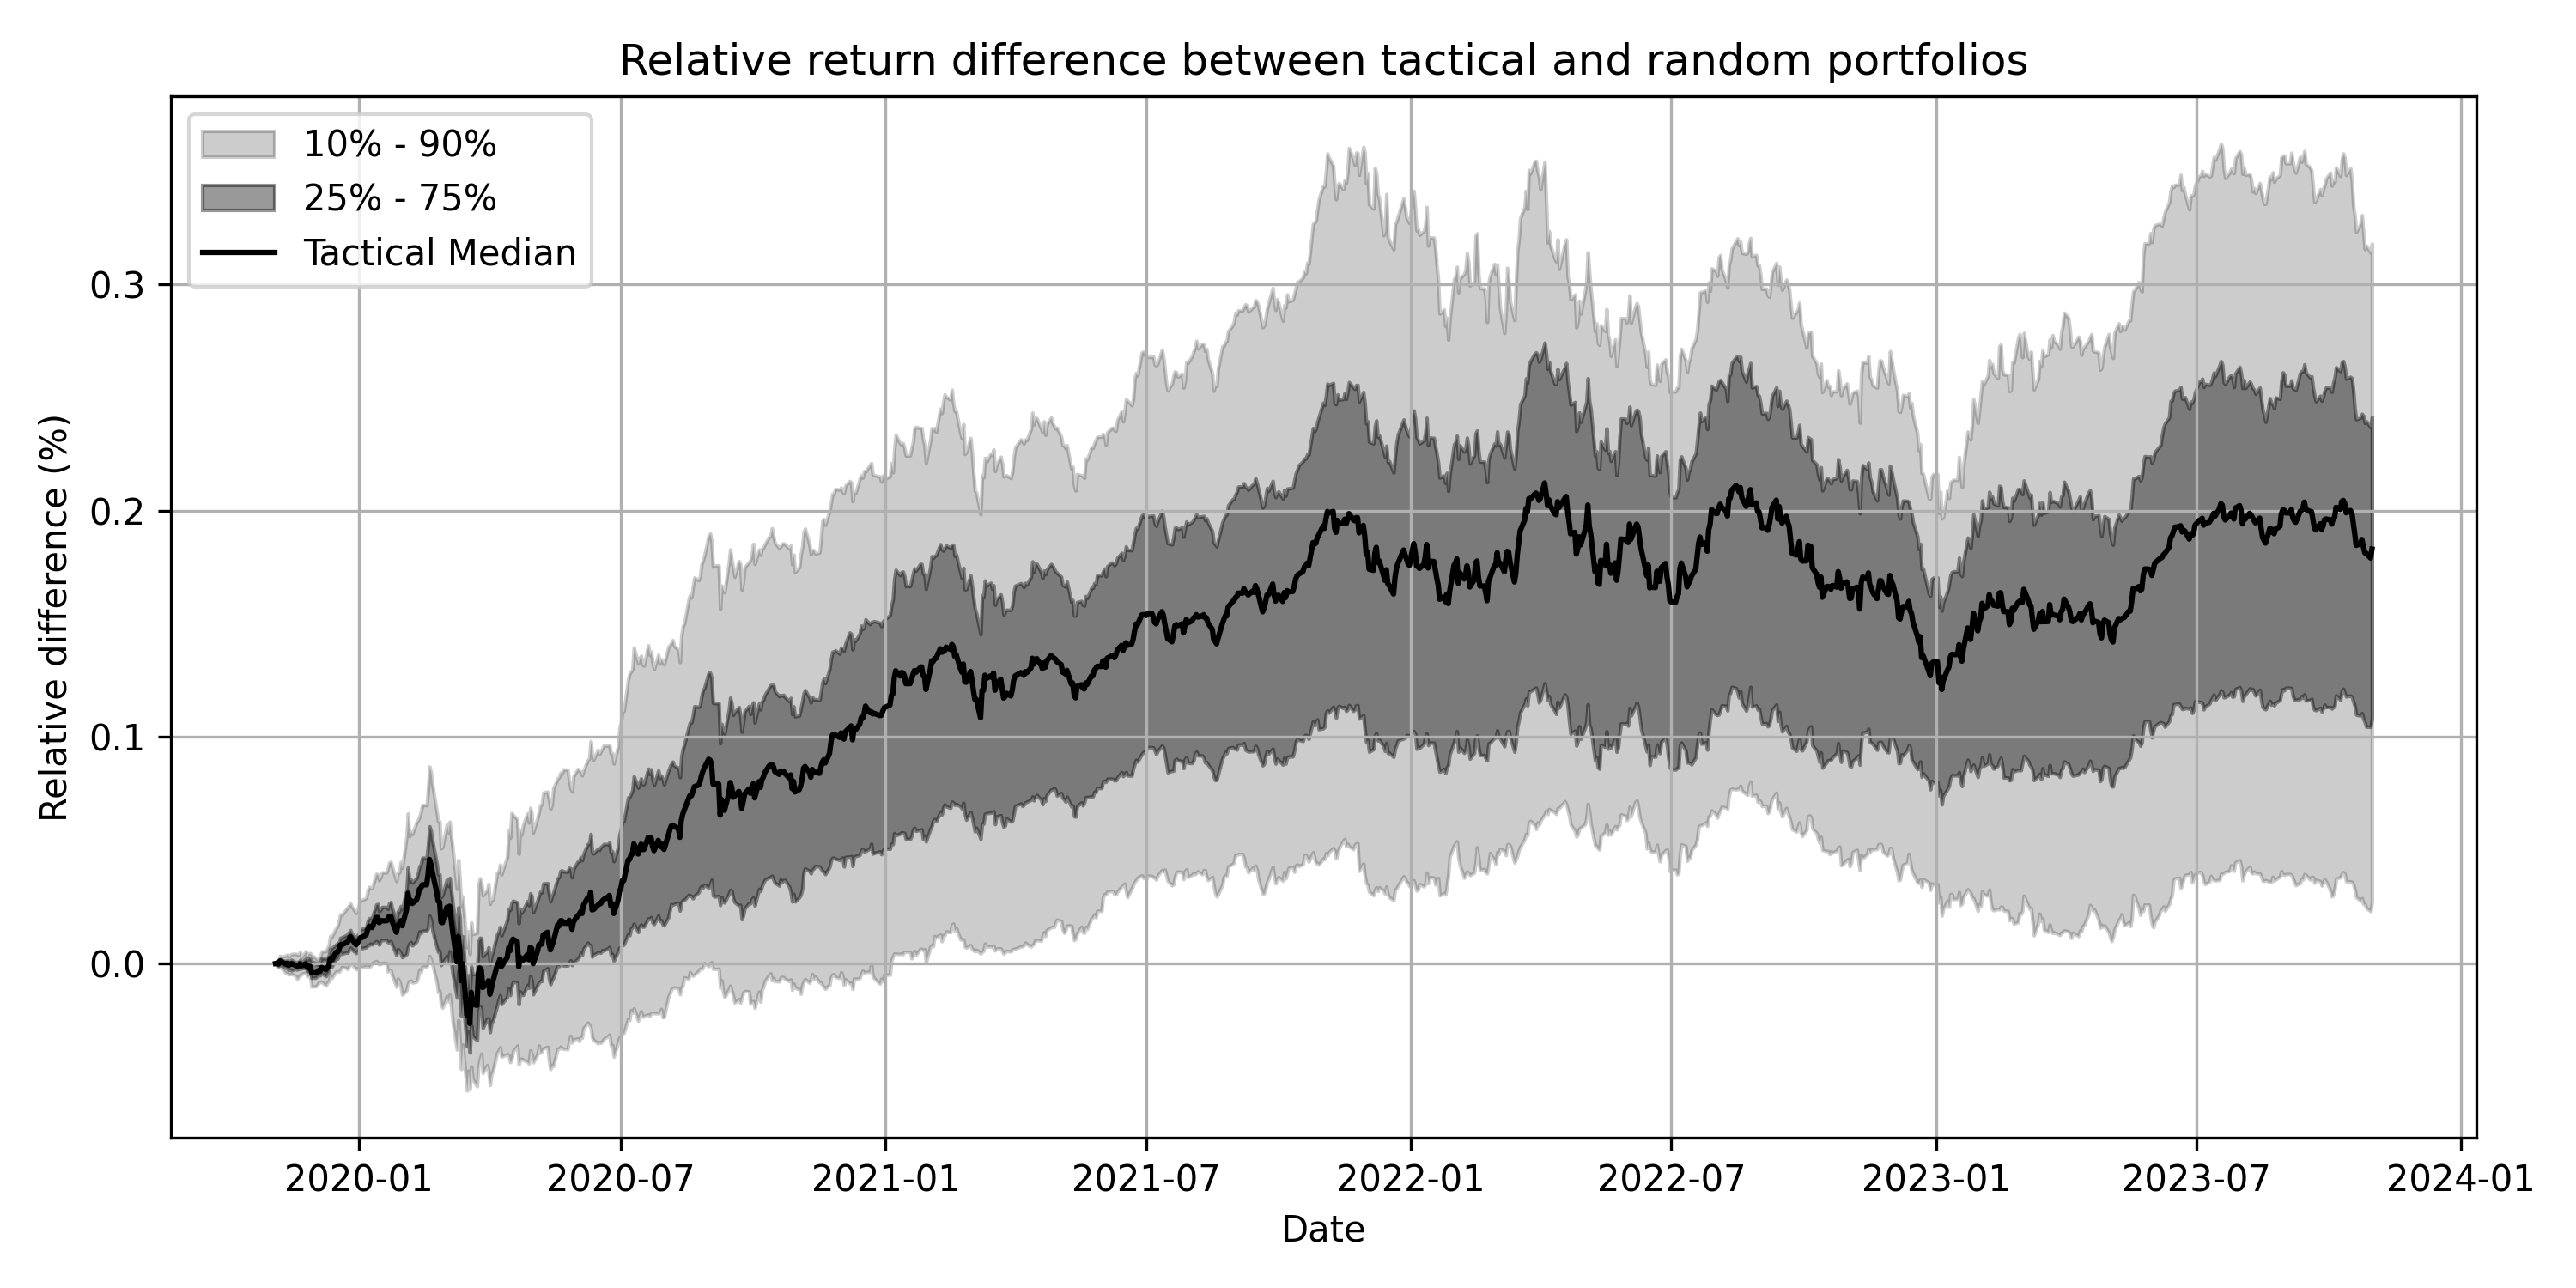
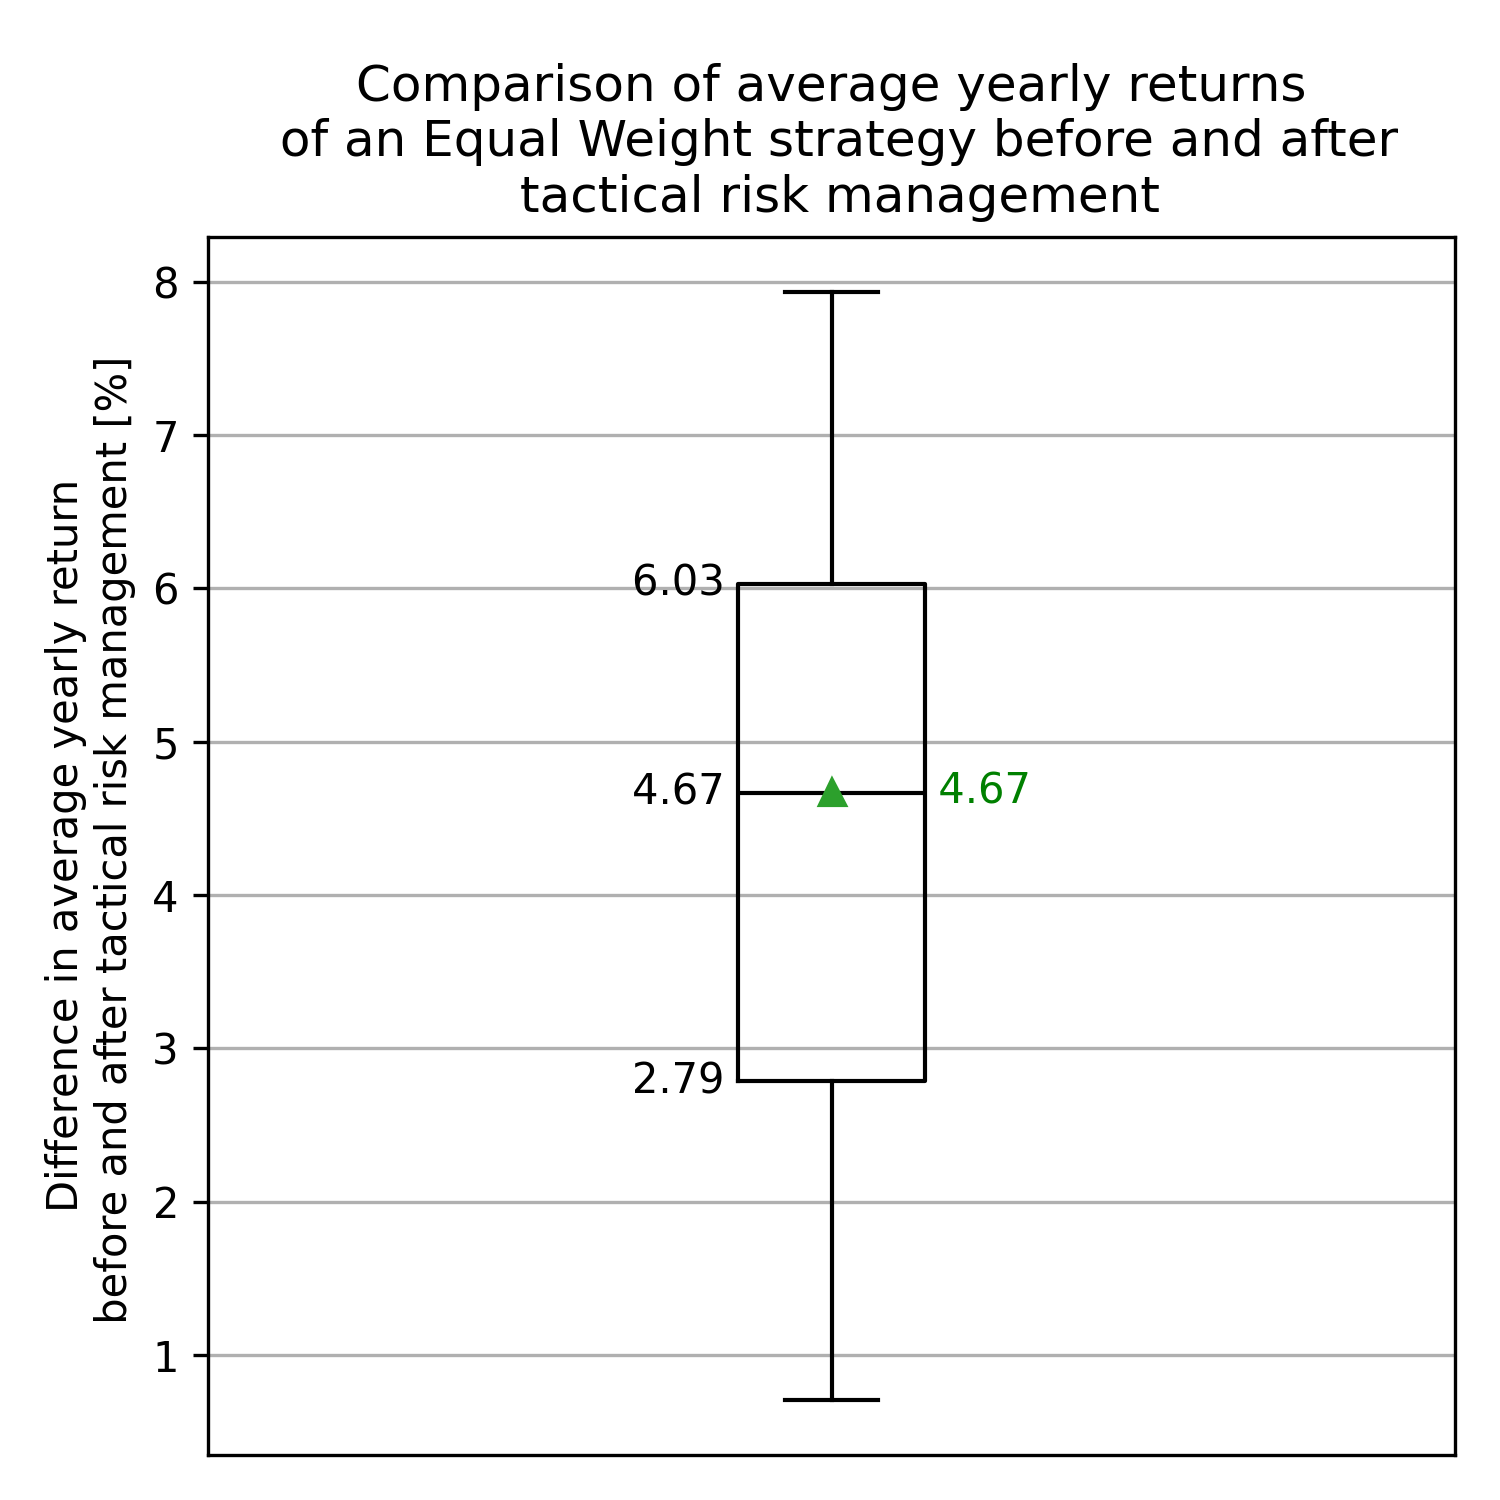
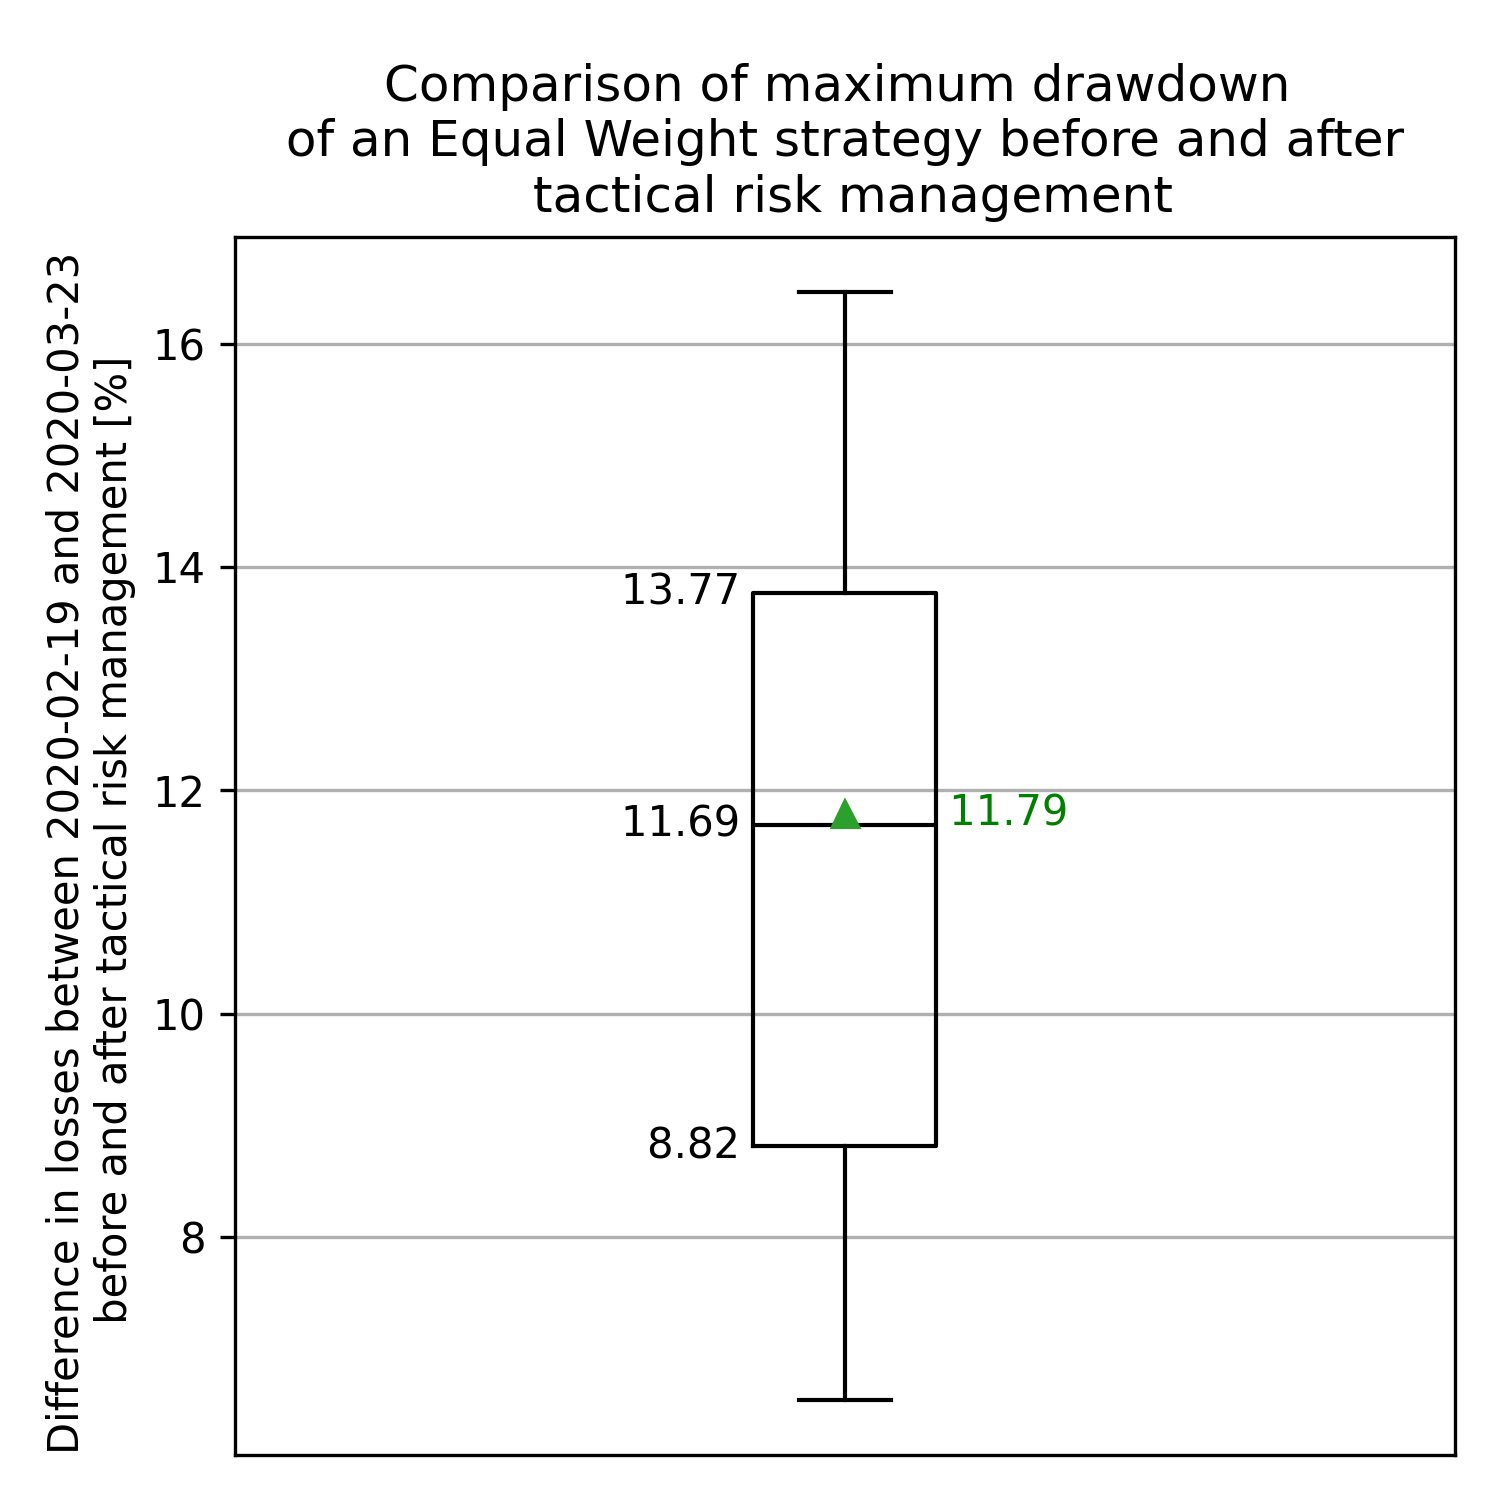
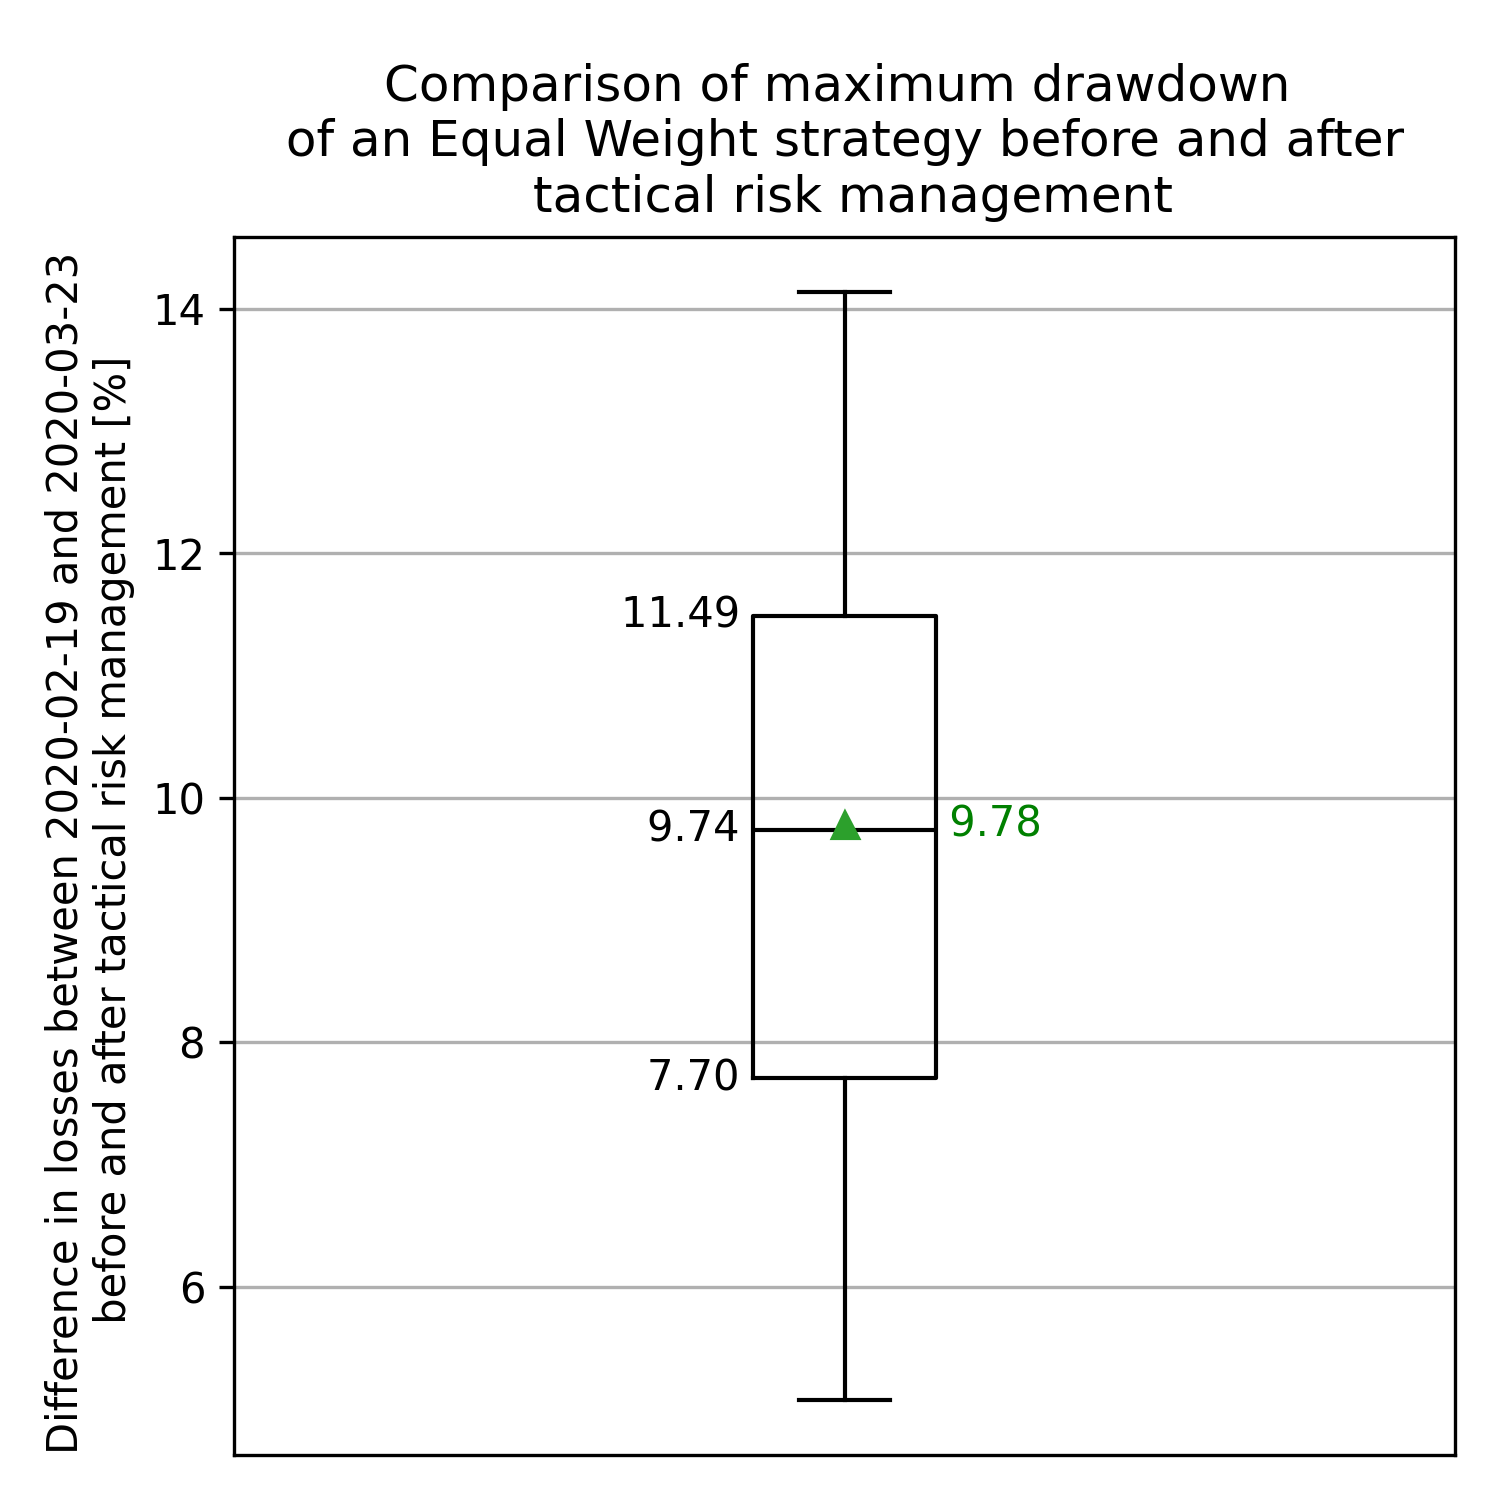
| Metric | Value |
|---|---|
| Mean | 4.67% |
| Maximum | 24.5% |
| 90th Percentile | 7.98% |
| Third Quartile | 6.03% |
| Median | 4.66% |
| First Quartile | 2.78% |
| 10th Percentile | 0.71% |
| Minimum | -5.2% |
ATR
Average True Range (ATR) is the average of true ranges over a specified period (in this case 14 daily candles). ATR measures volatility, taking into account any gaps in the price movement.
Similar to the Volatility methodology, ATR allocates weights based on the respective ATRs (expressed as a percentage of the price) of each components. This methodology favours volatility and tends to yield higher performance portfolios but carrying higher a higher risk.
The main difference between ATR and Volatility is that ATR considers the true prive range (daily highs / lows) whereas Volatility operates based on closing prices.
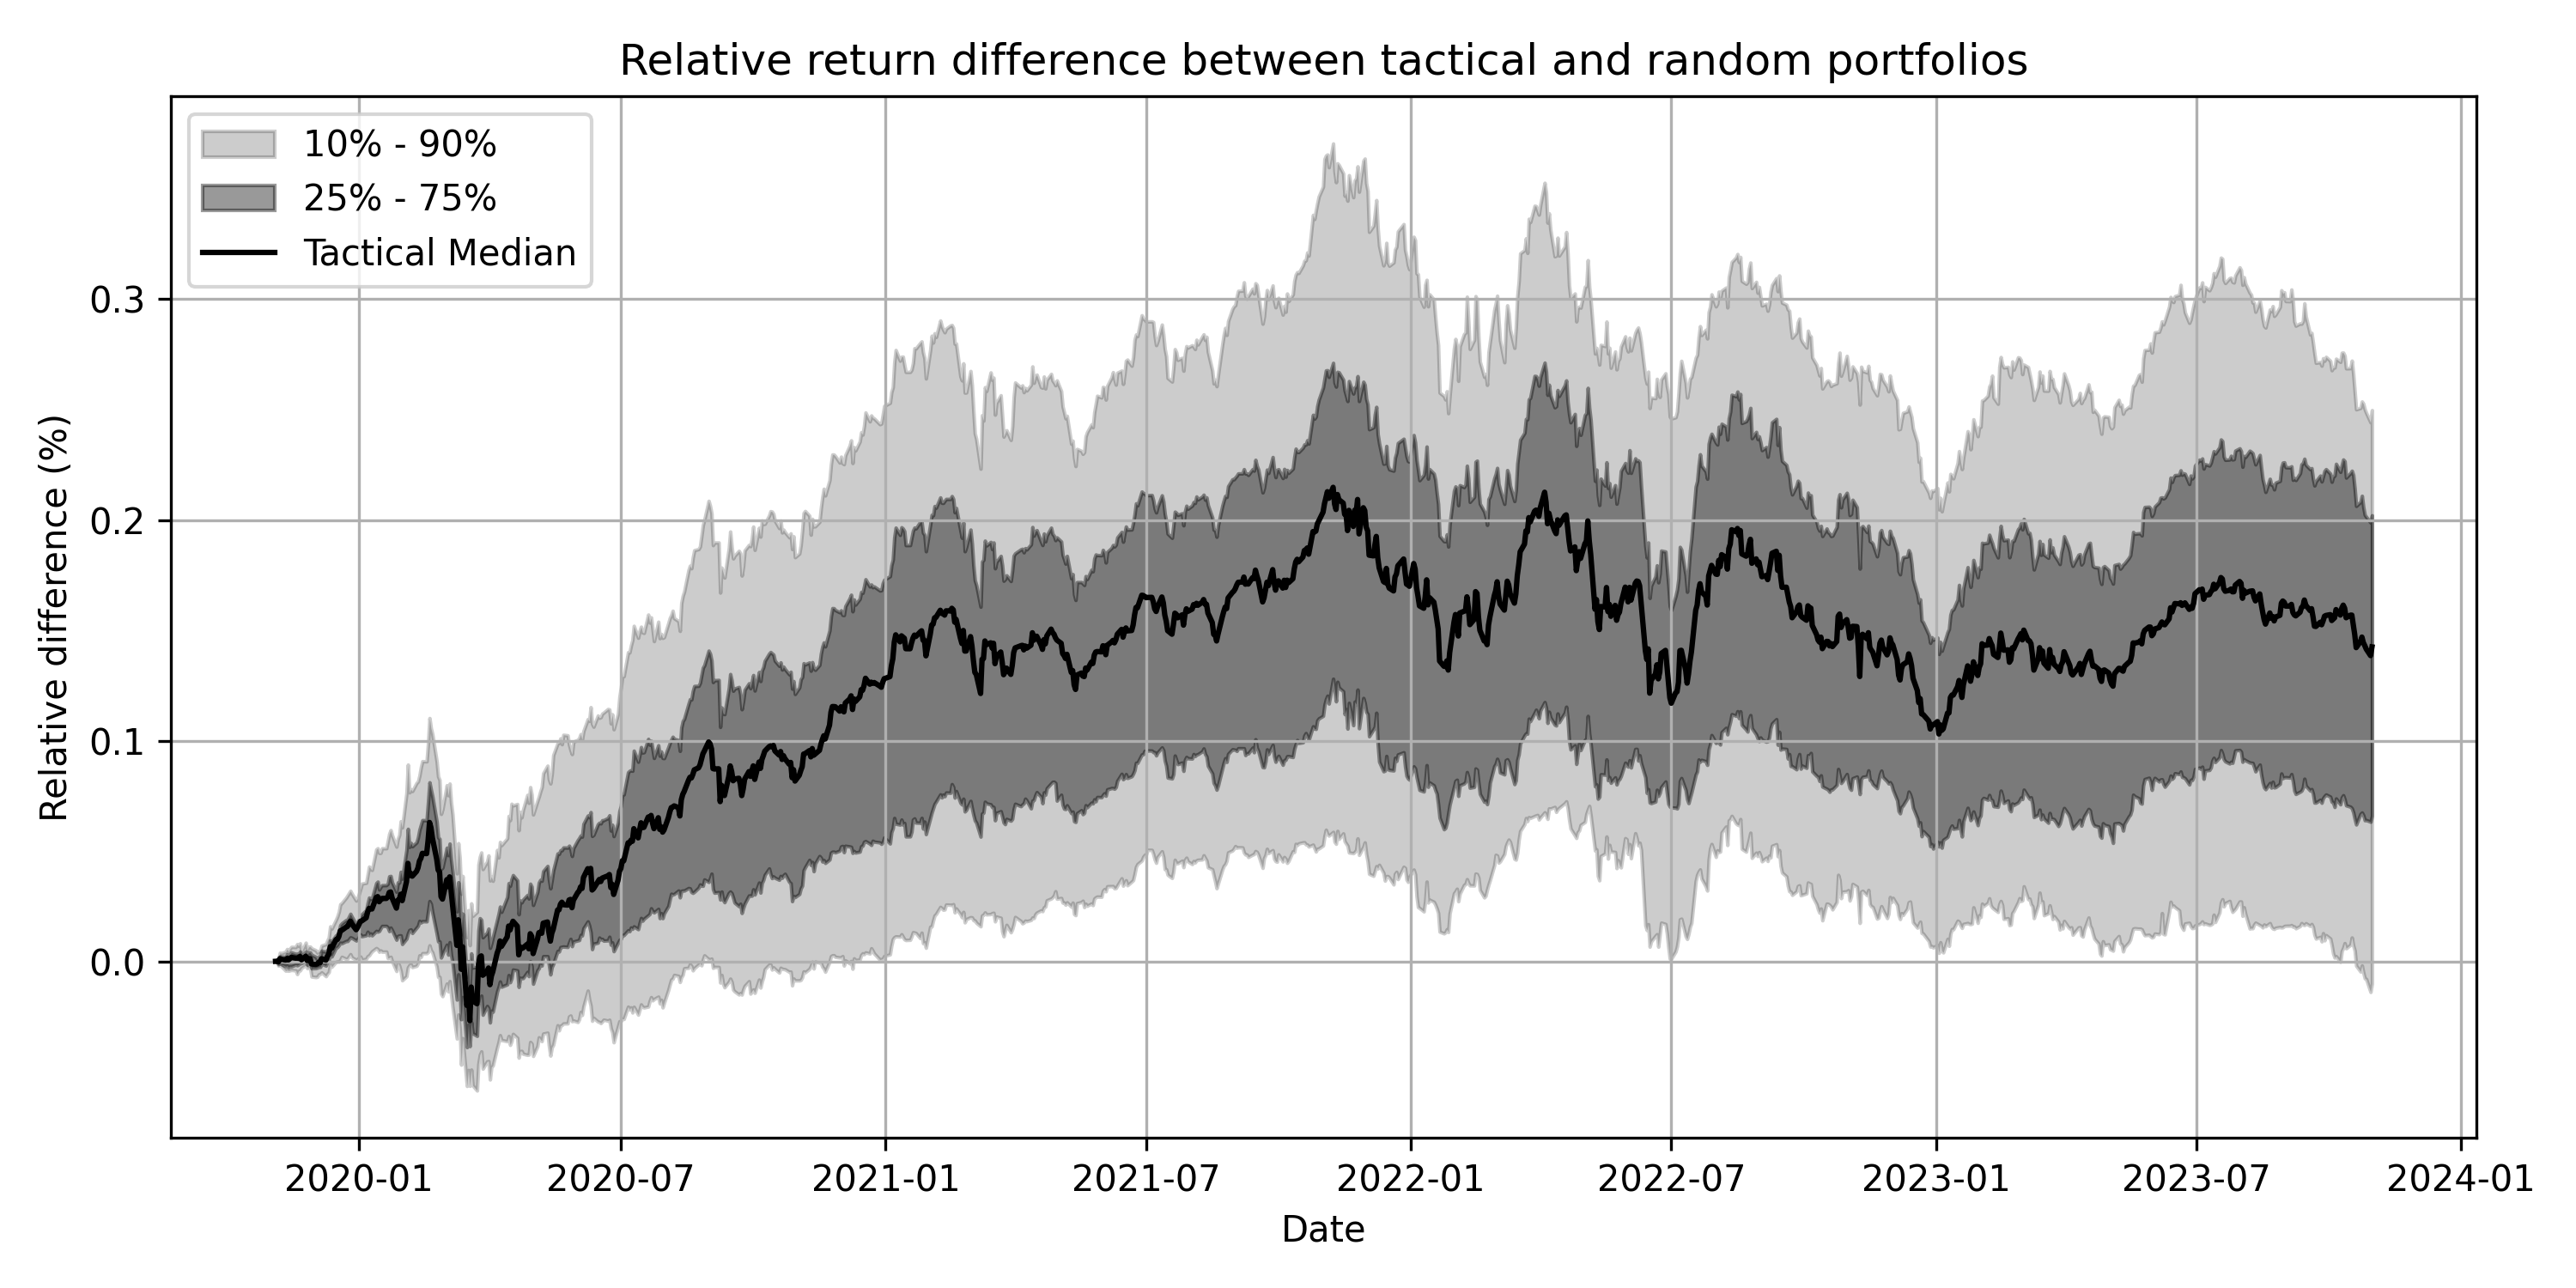
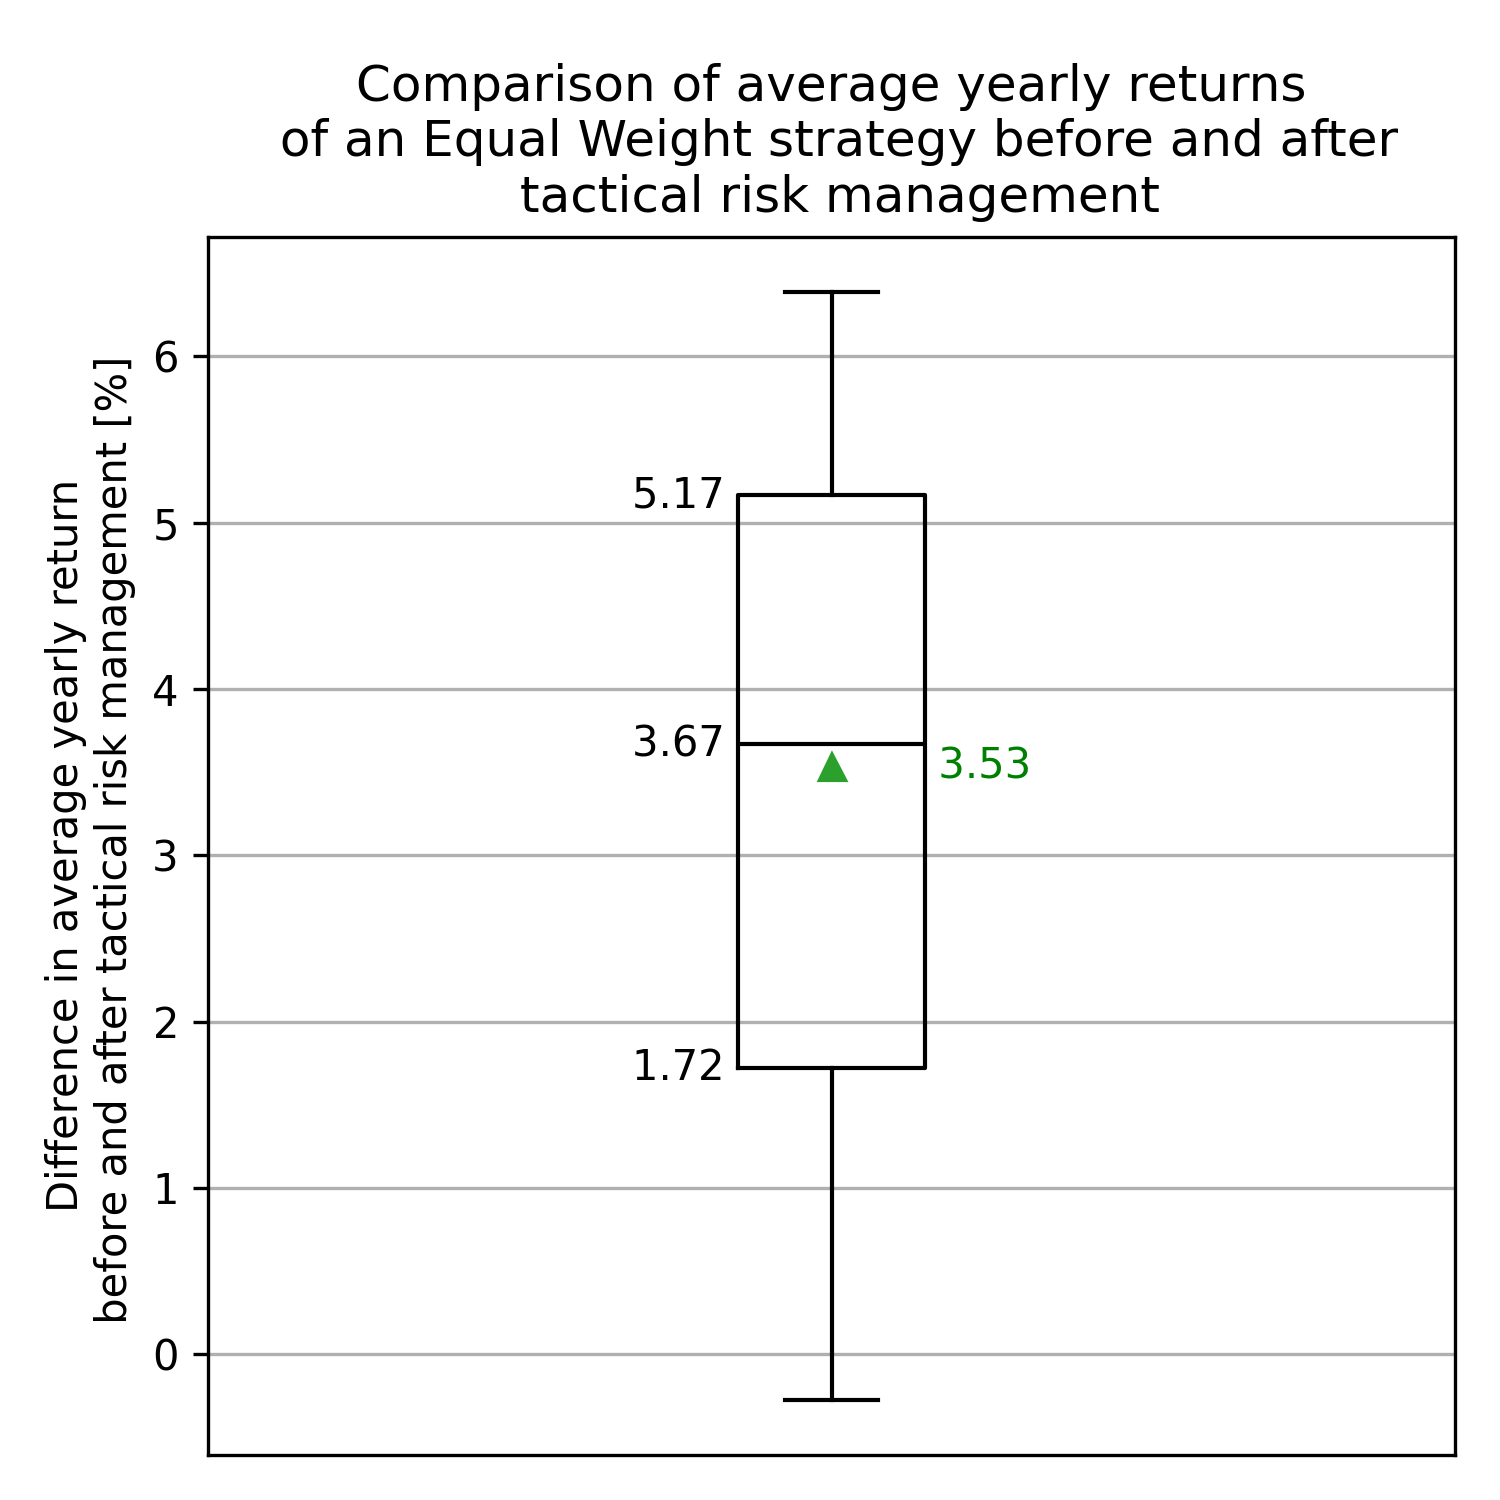
| Metric | Value |
|---|---|
| Mean | 3.53% |
| Maximum | 19.11% |
| 90th Percentile | 6.39% |
| Third Quartile | 5.16% |
| Median | 3.67% |
| First Quartile | 1.72% |
| 10th Percentile | -0.28% |
| Minimum | -7.64% |