Cashflow
Last updated: 2026-03-10
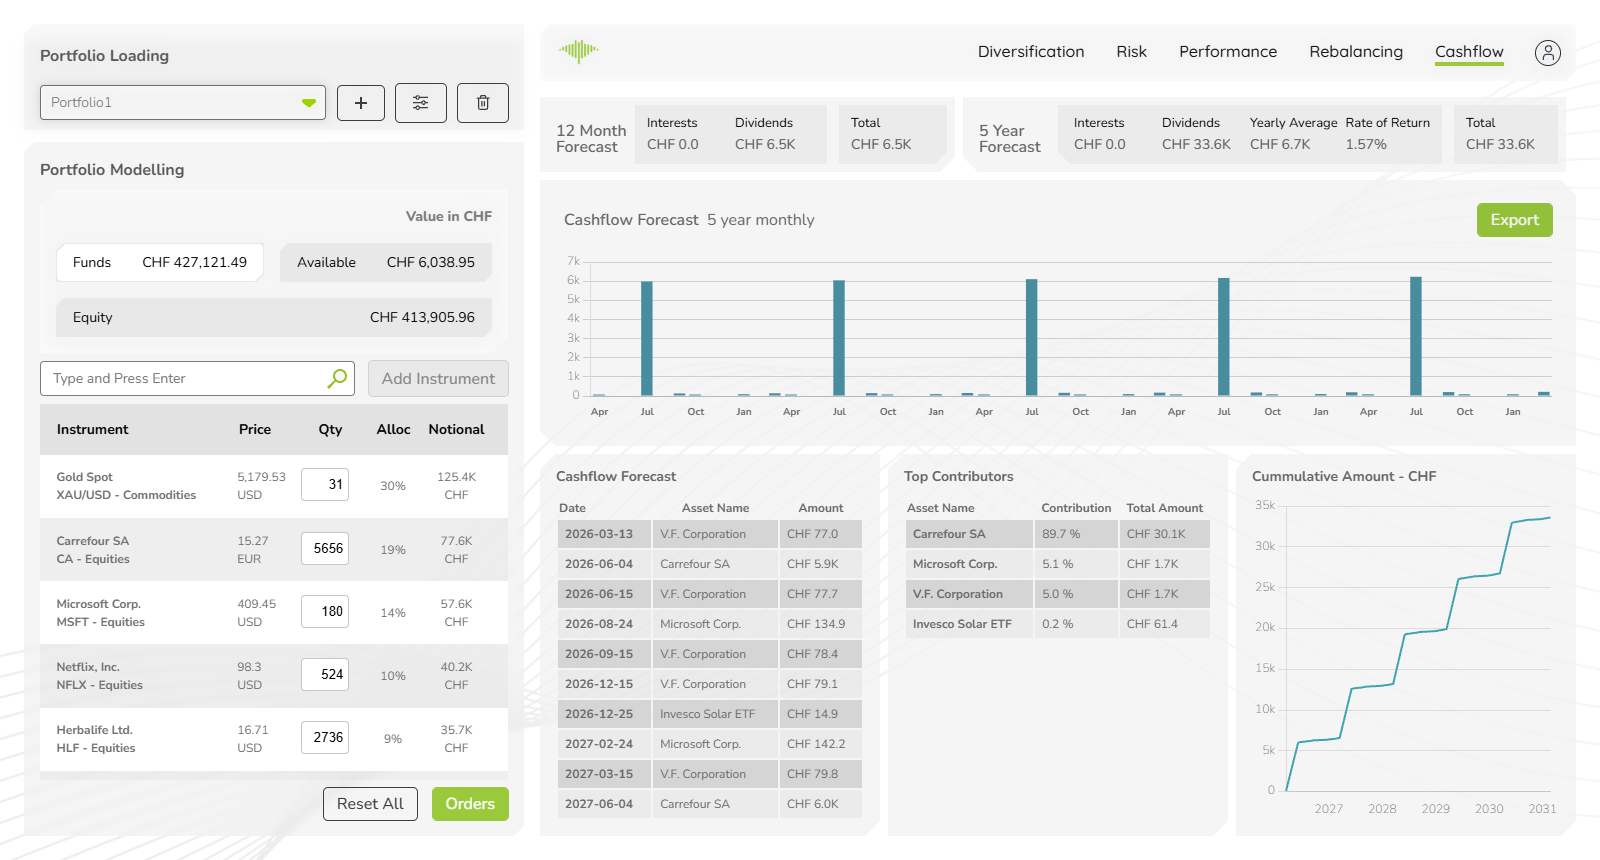
The Cashflow tab helps advisers plan ahead and demonstrate the income generation capability of a portfolio to clients. For income-focused mandates — retirees, endowments, or institutions with distribution requirements — being able to show the exact dates and amounts of expected payments builds confidence. It forecasts all expected income from the portfolio — dividends from equities and coupons from fixed income instruments — over both a 12-month and 5-year horizon, with export capability for client reports. Because coupon and dividend income is contractual rather than market-driven, it is treated separately from the price-return analytics (expected return, VaR and CVaR) — which are computed on dividend/split-adjusted and clean price series — and forecast here in its own right (see Expected Returns).
12 Month Forecast
Three summary cards show the total expected cashflow from the portfolio in the next 12 months:
| Card | Description |
|---|---|
| Interests | Expected coupon and interest income from fixed income instruments |
| Dividends | Expected dividend income from equities and funds |
| Total | Combined income from all sources |
5 Year Forecast
Five summary cards extend the forecast to a 5-year horizon:
| Card | Description |
|---|---|
| Interests | Total expected interest income over 5 years |
| Dividends | Total expected dividend income over 5 years |
| Yearly Average | Average annual income across the 5-year period |
| Rate of Return | Implied income yield on the portfolio |
| Total | Combined 5-year income from all sources |
Cashflow Forecast Chart
A stacked bar chart shows projected monthly cashflow across the full 5-year forecast period. Each bar represents one month and is divided into two components:
- Dividends (one colour) — equity and fund dividend payments
- Interests (another colour) — fixed income coupon payments
The chart makes it easy to identify which months have clustered payment dates (common in portfolios with bonds that pay semi-annually) versus months with low income. An Export button in the top right allows the chart data to be exported for use in client reports or further analysis.
Cashflow Forecast Table
A detailed table lists every expected cashflow event in chronological order:
| Column | Description |
|---|---|
| Date | Expected payment date |
| Asset Name | The instrument generating the cashflow |
| Amount | Expected payment amount in CHF |
This table is useful for matching income events to client liquidity needs or planning reinvestment timing.
Top Contributors Table
A separate table ranks the instruments by their total contribution to portfolio income:
| Column | Description |
|---|---|
| Asset Name | Instrument name |
| Contribution % | Percentage of total portfolio income generated by this instrument |
| Total Amount | Total expected income from this instrument over the forecast period |
This view quickly identifies which positions are driving the portfolio's income characteristics — useful for understanding concentration in dividend-paying names.
Cumulative Amount Chart
A line chart in the bottom right shows the cumulative total income from the portfolio growing over the 5-year forecast period. The stepped shape reflects discrete payment events rather than a smooth income stream. This view helps clients visualise total income accumulation over time.
