Diversification
Last updated: 2026-03-10
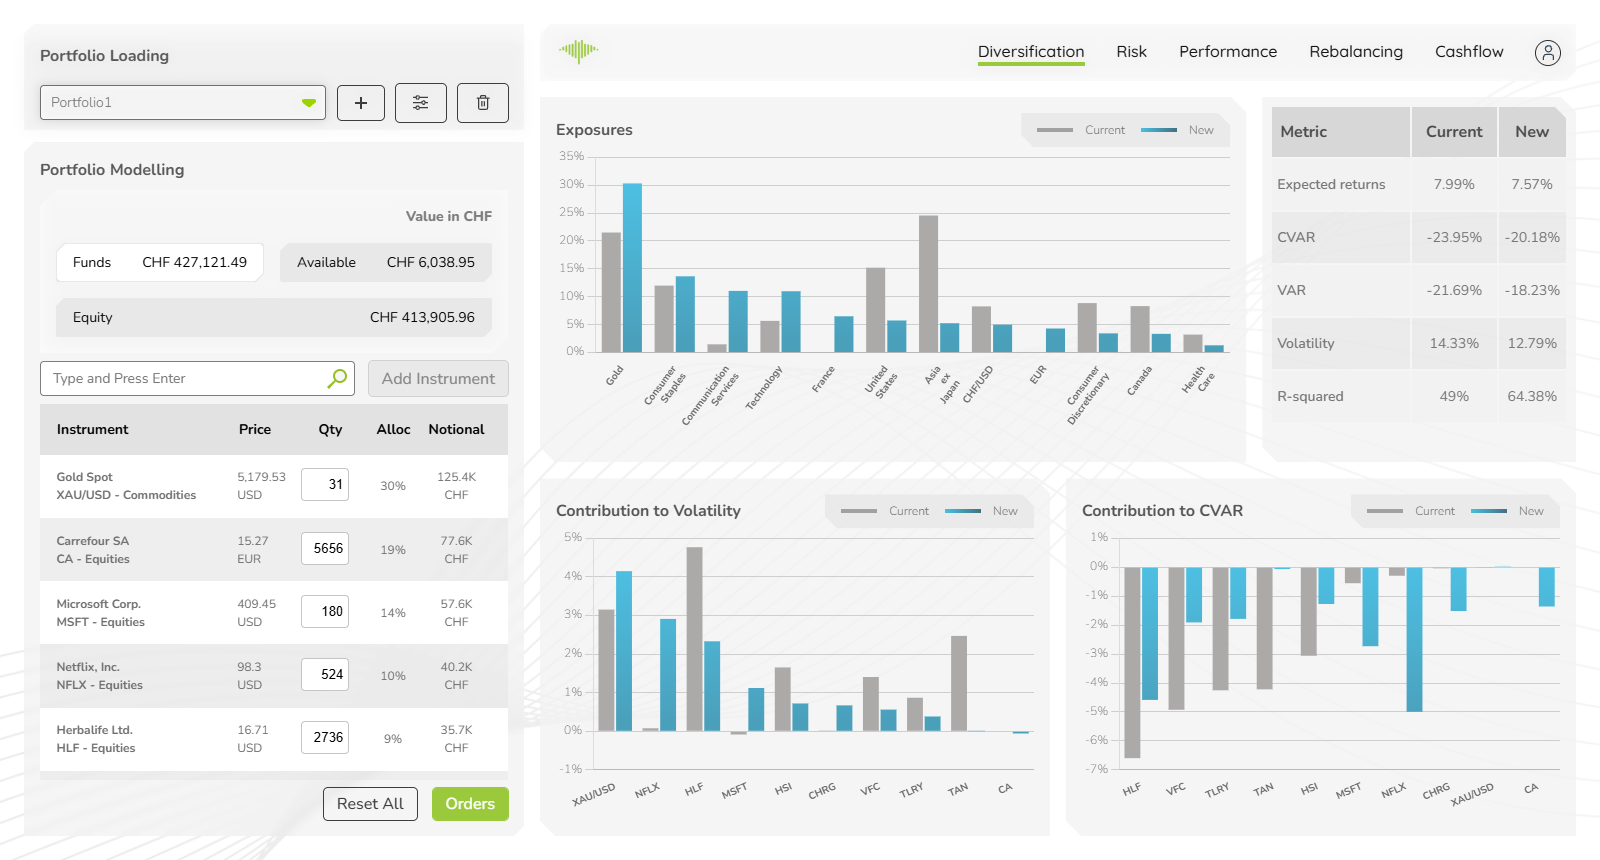
The Diversification tab lets advisers demonstrate to clients exactly how a proposed portfolio change improves or worsens diversification. Instead of presenting abstract allocation percentages, it shows the reduction in volatility contribution from a concentrated position, or the improvement in CVaR when adding a defensive instrument — providing the transparency needed to build trust and support the rationale for rebalancing decisions. Three charts and a statistics table update automatically whenever a position is modified in the left panel.
Exposures Chart
The Exposures chart shows portfolio weight allocated to each factor and asset class. Two bar series are displayed for every category:
- Current (grey) — the original portfolio as loaded
- New (blue) — the modelled portfolio after any changes
Categories shown include asset classes (Equities, Commodities, Funds, Index) and geographic/sector factors (Gold, Consumer Staples, Communication Services, Technology, France, United States, Asia ex Japan, CHF/USD, EUR, Consumer Discretionary, Canada, Health Care). This makes concentration risks immediately visible — an oversized bar in any single factor highlights potential over-exposure.
Contribution to Volatility Chart
This chart breaks portfolio volatility down by individual instrument. Each instrument's bar shows how much of the total portfolio volatility it contributes, again split into Current and New series.
A large bar for one instrument means that position is a dominant driver of portfolio risk. Reducing its weight or adding uncorrelated positions will shrink its contribution — and the chart shows the effect instantly.
Contribution to CVaR Chart
Similar in structure to the Contribution to Volatility chart, this chart shows each instrument's contribution to Conditional Value at Risk (CVaR). CVaR measures expected loss in the worst-case tail scenarios, so large negative contributions indicate positions that significantly increase extreme downside risk.
Some instruments may show positive contributions (acting as a hedge), while others increase tail risk. The New series shows immediately whether proposed changes improve or worsen the tail-risk profile.
Statistics Table
The statistics table in the top right summarises key portfolio metrics for both the current and new portfolios:
| Metric | Description |
|---|---|
| Expected Returns | Annualised expected return of the portfolio |
| CVaR | Conditional Value at Risk (expected tail loss) |
| VAR | Value at Risk at the configured confidence level |
| Volatility | Annualised portfolio volatility |
| R-Squared | Proportion of variance explained by the factor model |
Comparing the Current and New columns gives an immediate read on whether proposed changes improve the risk-adjusted profile before any order is placed.
