Credit Risk
Last updated: 2026-11-03
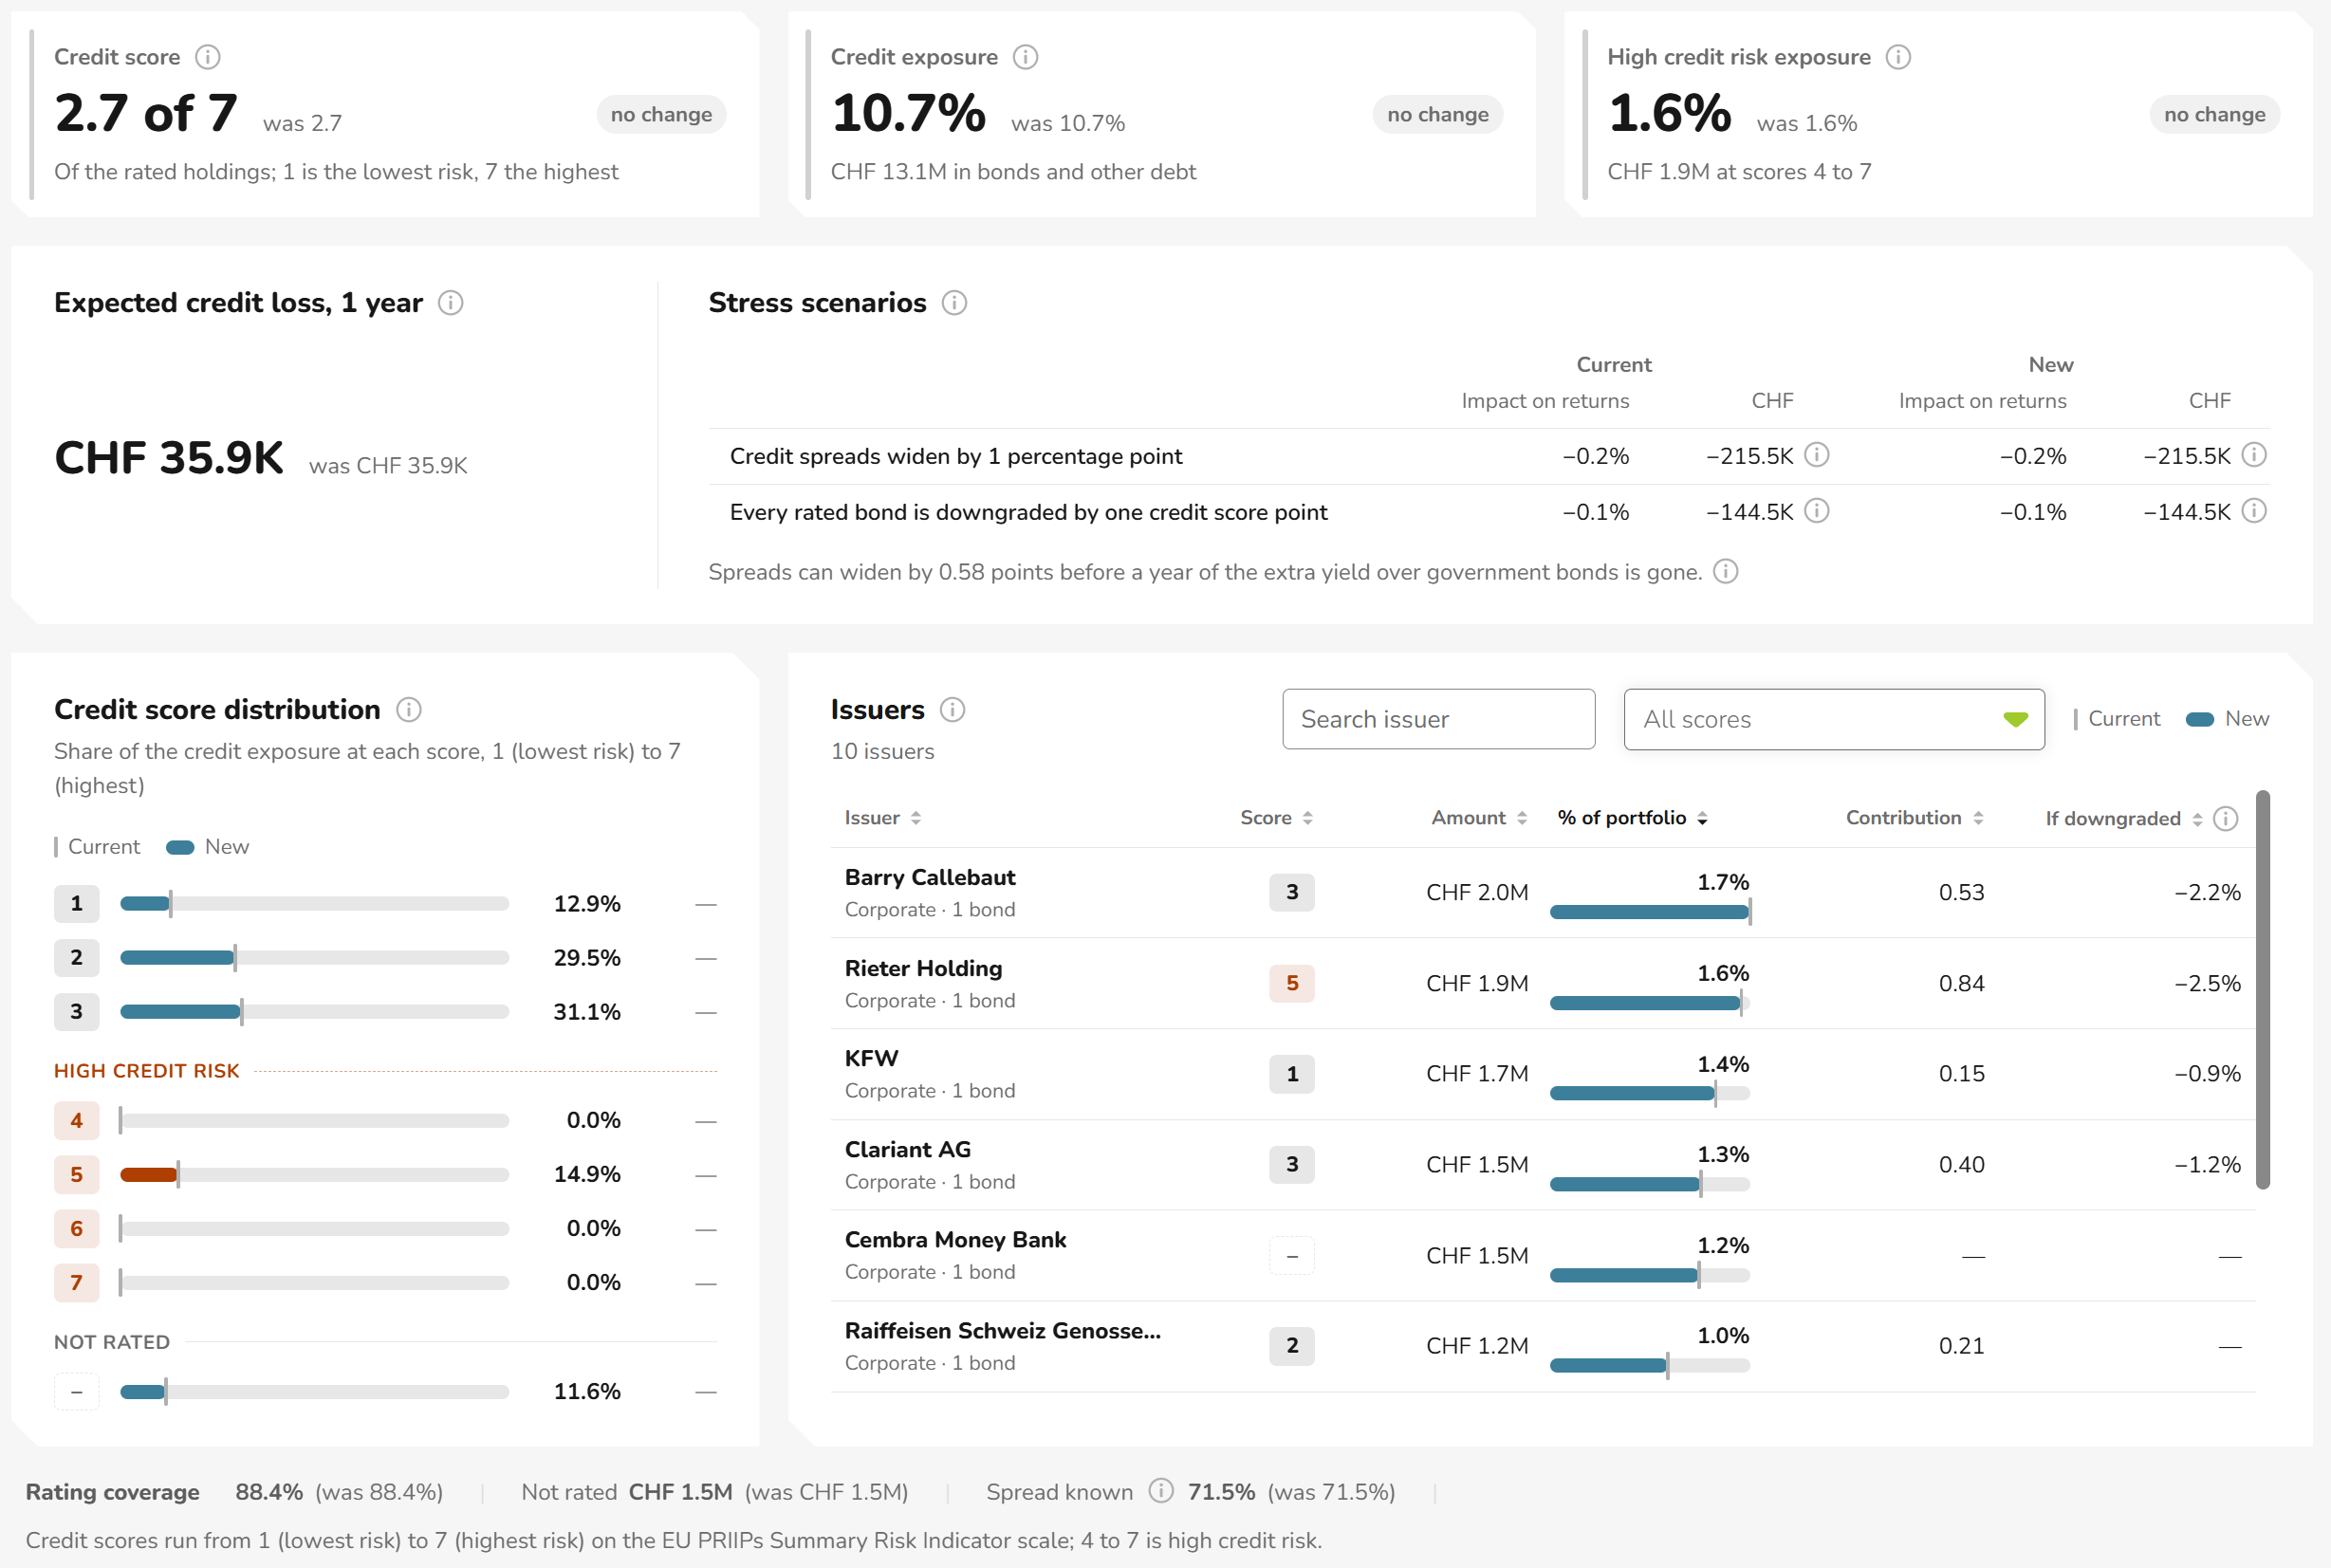
The Credit Risk view shows the risk of default in the portfolio's bonds and other debt: how creditworthy its issuers are, what defaults could cost in an average year, and what a credit shock would do to it. Advisers can check, before any order is placed, whether a proposed change makes the portfolio's credit risk better or worse, and explain it to the client in plain figures.
Open it from the Risk tab, under Credit Risk in the list on the left.
The view compares two portfolios: Current, the portfolio as loaded, and New, the modelled portfolio after any changes made in the Portfolio Modelling panel on the left. All figures update automatically whenever a position is modified. Hover the ⓘ icon beside a figure or column heading for its definition. If one of the two portfolios cannot be analysed, the view shows the other on its own and says why.
What Counts as Credit
The view covers the bonds, loans and money-market instruments the portfolio holds long, at market value. Funds and ETFs, bond funds included, are left out: a fund cannot default, and losses on its bonds show in its price, which is market risk. A loan the client owes is not credit exposure either. When the portfolio holds no debt, the view says so.
Credit Scores
Each rated credit holding has a whole score from 1 (lowest risk) to 7 (highest risk), on the scale of the EU PRIIPs Summary Risk Indicator. Scores 4 to 7 (BB+ and worse) are high credit risk. Holdings without a score are counted as Not rated.
Scores are calculated by the MantaRisk quantitative model. They are not credit ratings issued under the EU Credit Rating Agencies Regulation; see Credit Risk methodology.
Headline Figures
Three tiles across the top summarise the new portfolio. Each shows the new figure, the current one after "was", and the change.
| Figure | Description |
|---|---|
| Credit score | The market-value-weighted average score of the rated holdings. Lower is better |
| Credit exposure | The bonds and other debt held, at market value, as a share of the portfolio. Neither higher nor lower is better in itself |
| High credit risk exposure | The share of the portfolio held at scores 4 to 7, with its amount. Lower is better |
Expected Credit Loss, 1 Year
The average yearly cost of defaults over the next year: for each bond, its value × its chance of default × the share lost if it defaults, added up. It is an average, not a forecast. In most years no issuer defaults and nothing is lost; in a year one does, the loss is far larger. When some bonds lack the figures needed, the ⓘ says how much of the credit exposure the figure covers.
Stress Scenarios
What the portfolio would lose at once in two credit shocks:
- Credit spreads widen by 1 percentage point for every bond
- Every rated bond is downgraded by one credit score point, its spread widening to the typical spread of the worse score
Each scenario shows the impact on the portfolio's returns and the amount in the portfolio's currency, for the current and the new portfolio. Only price changes are counted. Bonds without maturity or coupon data are left out; when that leaves part of the holdings uncovered, a ⓘ beside the figure says what share of the credit exposure (or, for the downgrade, of the rated bonds) it covers.
The sentence under the table says, for the new portfolio, how far spreads can widen before a year of the extra yield earned over government bonds is gone. The wider that margin, the more of a spread shock the portfolio's yield absorbs.
Credit Score Distribution
Each score's share of the credit exposure, from 1 at the top to 7 at the bottom. A rule marks where high credit risk starts, and Not rated holdings sit underneath. Each bar and the figure beside it show the new portfolio. When comparing, a mark on the bar shows where the current portfolio stands, and the column on the right gives the change in percentage points.
Issuers
Every issuer the portfolio holds debt of, largest share of the portfolio first.
| Column | Description |
|---|---|
| Issuer | Name, sector and number of bonds held |
| Score | The worst credit score among the issuer's bonds |
| Amount | Market value held, in the portfolio's currency |
| % of portfolio | The issuer's share of the portfolio, new against current |
| Contribution | The issuer's part of the average credit score; the issuers' contributions add up to it |
| If downgraded | The price change of the issuer's rated bonds if each is downgraded one score. An issuer already at 7 cannot be downgraded and shows a dash, as does one with no figure for it |
- Sort by clicking any column heading.
- Search for an issuer by name.
- Filter by score with the dropdown: all scores, high credit risk (4 to 7), a single score, or not rated.
- Hover an issuer to list its bonds, each with its share of the portfolio, chance of default, recovery, spread and yield.
Tags under the issuer's name flag what needs attention:
- 20% or more: the issuer's debt is 20% or more of the new portfolio. FINMA Circular 2025/2 treats this as a sign of unusual concentration that the client should be told about. It is a guide, not a limit, and shares of the same issuer are not counted.
- Public sector: a government, supranational or municipal issuer.
- New or Sold: the proposed change adds the issuer or sells it outright. A sold issuer's row shows the current holding.
Rating Coverage
A line below the panels shows how far the figures can be relied on, for both portfolios:
| Figure | Description |
|---|---|
| Rating coverage | The share of the credit exposure that has a credit score |
| Not rated | The value of the credit holdings without a score |
| Spread known | The share of the credit exposure whose credit spread and spread duration are known, which the spread margin sentence relies on |
Comparing the current and new figures shows whether a proposed change improves the portfolio's credit quality, reduces what defaults could cost, or concentrates the portfolio in a weaker issuer, before any order is placed.

